New Introducing Valora & Optara by ANIVA AI — truckload network value for your fleet and carrier bidding, selection and execution for the shipper. Explore the productsLearn more →

ANIVA Enterprises · Consulting Services

Logistics & Supply Chain Consulting

Network design, carrier procurement, process excellence and measurable cost savings — delivered on-site, hands-on, by a senior practitioner.

42+ years of logistics & supply chain leadership
5–10% typical savings on logistics & supply chain spend
4 · 16 phases · steps, with customer sign-off closing every phase
60–90 days on-site, embedded in the customer's team

What we do

Focus, approach and value proposition

Magnifying Glass

Focus

Established in 2007, ANIVA is a Delaware Corporation focused on:

  1. Logistics network optimization
  2. Network value / margin expansion
  3. Low-cost (core) carrier setup
  4. Bid proposal development
  5. Performance measurement / KPI
  6. Supply chain process compliance
  7. Labor Planning & Optimization
  8. Process redesign / documentation
  9. Low-cost country sourcing by collaborating with suppliers to assist U.S. companies in achieving lower total landed costs
Approach

Approach

Our proven 4-phase, 16-step design process guides us in creating the least-cost logistics and supply chain solution:

  • We become an integral part of the customer organization and help set up new logistics & supply chain capabilities (design, processes, training) and participate in deployment
  • We specialize in developing implementable cost reduction strategies and process improvement
  • We spend 60-90 days with our customer at their site or work remotely in creating the solution(s) based on the customer need, size, and complexity
Dollar Sign

Value Proposition

Depending on the project, we generate cost savings of 5–10% of the customer's logistics & supply chain spend by:

  1. Applying our expertise
  2. Engaging key stakeholders
  3. Conducting "what-if" scenarios
  4. Participating in implementation

Our demonstrated methodologies with Valora, custom-built Excel-based models, off-the-shelf software packages and footprint tools give us the competitive edge to successfully solve our customers' logistics and supply chain operational issues and exceed their expectations.

How we work

From agreement to measured value — six stages, repeated on every engagement

On-site, inside the customer's team, typically 60–90 days — with value measured against a baseline agreed before the work begins and customer sign-off at every gate.

  1. 1Align & Scope
  2. 2Discover
  3. 3Model & Analyze
  4. 4Build & Document
  5. 5Implement
  6. 6Measure & Sustain

Customer sign-off gate  ·  click a stage to see what happens

Stage 1 of 6 · Week 1

Align & Scope

We start with your team: kick-off with leadership, a clear problem statement and scope — and, critically, the baseline that value will be measured against.

  • Core customer team and a weekly review cadence
  • Scope, deliverables and timeline agreed
  • Baseline set → customer sign-off

You own: scope document and agreed targets

Stage 2 of 6 · Weeks 1–3, on site

Discover

We walk the operation, interview the people who run it and map the current state — then capture and cleanse the data until it reconciles.

  • Current-state flows, hand-offs and pain points
  • Data capture, cleansing and validation
  • Benchmarks against targets

You own: a single source of truth

Stage 3 of 6 · Weeks 3–6

Model & Analyze

We develop the model and the tool that fits the need, run what-if scenarios and quantify the opportunity — validated with Finance and Operations.

  • Logistics network/supply chain design, NV/TSC, bid selection, labor-demand or cost models
  • Scenarios ranked by value — markets, lanes, carriers, customers, labor
  • Findings validated with Finance and Operations

You own: refreshable models and a quantified opportunity

Stage 4 of 6 · Weeks 5–8

Build & Document

Decision-support tools and future-state network, process or strategy development — pressure-tested with the people who will run it, with business rules, RACI and KPIs defined up front.

  • Build the decision-support tool and complete testing; future-state design and business rules
  • RACI and standard operating procedures
  • KPIs agreed → design buy-in sign-off

You own: documented design, SOPs and RACI

Stage 5 of 6 · Weeks 8–12

Implement

We deploy the tool, run the bid and roll-out the process — side by side with your team until it is fully operationalized.

  • RFQ rounds, pilots and tool deployments
  • Super-users and operating teams trained
  • Awards, onboarding, routing guides and systems loaded

You own: live tools, carrier contracts and a trained team

Stage 6 of 6 · Ongoing

Measure & Sustain

Savings and service are tracked against the agreed baseline, with a KPI dashboard and regular reviews — and decision-support tools and models your team re-runs on its own.

  • Savings and service vs. baseline
  • Dashboard, monthly and quarterly reviews
  • Lessons learned → next wave: measure, refine, repeat

You own: KPIs and governance — value-delivered sign-off

The detailed work plan

A proven, repeatable 4‑phase, 16‑step design process

The work plan behind the six stages, run on every engagement since 2007 — from first agreement to implemented solution, with customer sign-off closing each phase. Numbered circles are the sixteen steps; green boxes mark phase completion.
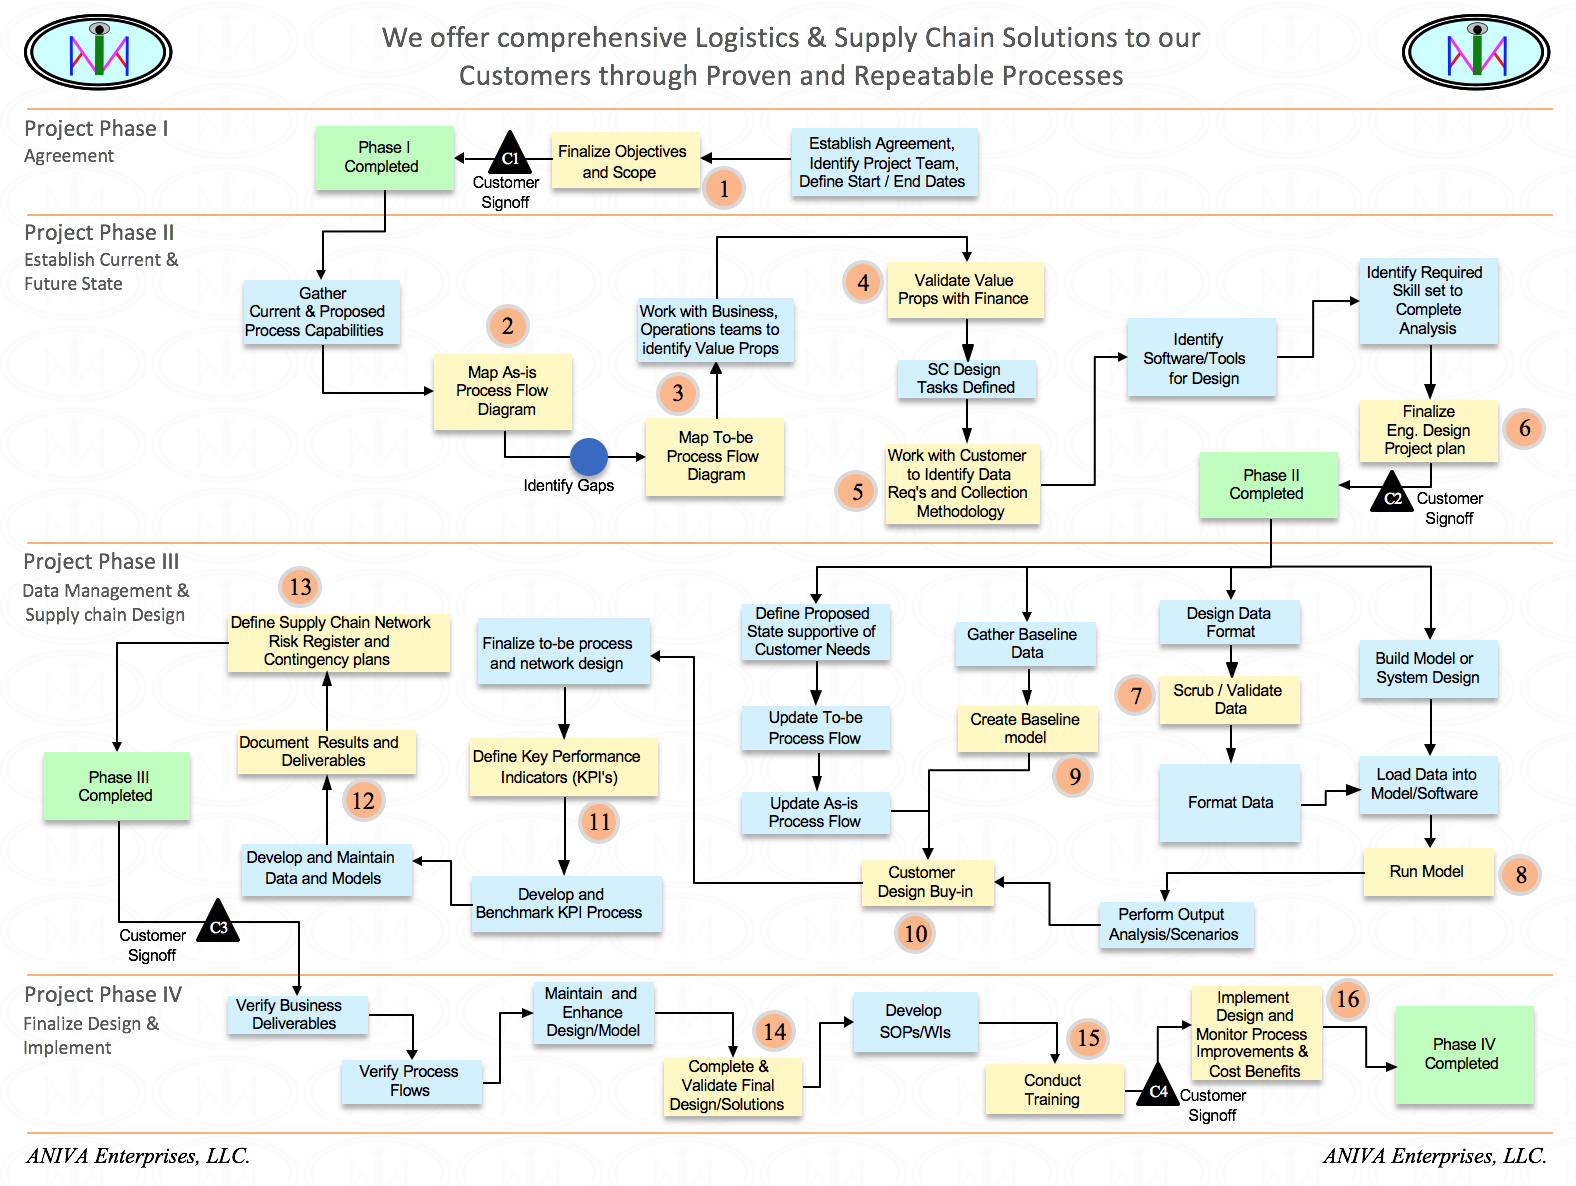
ANIVA 4-phase, 16-step logistics and supply chain design process flow chart The complete 16-step flow, phase by phase — click to open full size
I
Agreement Objectives, scope, project team, start / end dates
›
II
Establish Current & Future State As‑is / to‑be process flows, value propositions, data plan, tools
›
III
Data Management & Supply Chain Design Baseline, model, scenarios, design buy‑in, KPIs, risk register
›
IV
Finalize Design & Implement Validate, SOPs, training, implement & monitor cost benefits

Customer sign-off closes every phase (C1 – C4)

To make an immediate appointment for ANIVA Enterprises Logistics & Supply Chain Consulting services, please contact Dr. Mani Manivannan via email at mani@anivaenterprises.com

Explore

How we work and what we have delivered

Strategic

3 - 5 years horizon

  • Logistics network optimization
  • Supply chain design
  • Warehouse & cross dock location/allocation
  • Inventory & material planning
  • Network value & contribution margin analysis

Tactical

1 - 3 months horizon

  • Creating quick-win cost savings opportunities and identifying fast resolutions to supply chain operational issues
  • Performing current state analysis, value stream mapping, and evaluating gaps in the process and making appropriate recommendations to bring quick wins

Customer Engagements
& Value Creation

Selected customer work

  • Network profitability, cost reduction, revenue enhancement and optimization
  • Carrier procurement & bid strategy across ocean, air, LTL and truckload
  • End-to-end process redesign, SOPs, RACI and KPIs

Customer Engagements & Value Creation

A sample of consulting engagements across trucking and air cargo, oil & gas, chemicals, automotive, beverage, retail, industrial services and consumer products. Customer identities are withheld; each summary describes the situation, our role, and the value delivered at a high level. Use the filters to browse by theme, and expand any card for the detail.

01
Industrial Services · Workforce Planning 2025 – 2026

Labor Demand Planning & Workforce Visibility Toolset

A regional industrial-services contractor deploying company field labor and subcontractors across plant-outage, embedded on-site and general service work had little visibility into how its labor pool was being used and no structured way to pre-plan staffing for upcoming projects. ANIVA led discovery on site and built an integrated decision-support toolset the customer's own team now runs.

Value Full labor-utilization visibility What-if staffing for future projects Monthly KPI dashboard
What we did
  • Ran on-site discovery with the leadership team, documented scope and secured approval; reviewed planning processes and data across the three lines of business
  • Captured and cleansed a full fiscal year plus the current quarter of time, payroll, pricing and job data through weekly stakeholder reviews into a single source of truth
  • Designed and built an integrated toolset — customer quantification supporting a grow / fix / exit strategy, rolling 12-month labor-pool optimization, labor by customer, a daily labor-usage dashboard, a labor demand estimator for what-if pre-planning of company vs. subcontractor labor, and a stand-alone area-manager staffing tool
  • Deployed it as a centrally administered application on the customer's platform with security, drill-down filters and visualizations; wrote the SOP / work instructions and delivered several weeks of hands-on super-user training
  • Defined KPIs and a monthly management dashboard, a prioritized list of improvement initiatives with owners and target goals, and a weekly / monthly / quarterly governance cadence
Value delivered
  • A deployed toolset the customer's super-user refreshes independently, now producing monthly KPIs and the management dashboard
  • Daily, monthly and yearly visibility into labor usage and performance across all areas, and the ability to plan company labor vs. subcontractors before a project starts
  • A prioritized improvement roadmap and review cadence for the year ahead
02
Retail · Private Fleet & Network 2024

Transportation Network Profitability & Optimization

A Fortune 10 retailer with a private fleet and a supplier-to-DC / DC-to-store network wanted to understand true network profitability beyond lane-level cost accounting, and to cut empty miles and lane cost across inbound and outbound flows. ANIVA developed a portfolio of opportunities anchored by a network profitability methodology.

Value Network profitability model Fewer empty miles Balanced headhaul / backhaul
What we did
  • Reviewed the existing lane-profitability model and developed a methodology to represent overall network profitability by business area, including an outbound P&L
  • Developed a Network Value Model to improve profitability and Total System Contribution by market area
  • Computed deadhead ratios by lane and shaped planning and execution solutions to reduce empty miles
  • Analyzed freight flows to build a headhaul / backhaul strategy that combines inbound and outbound networks
  • Framed asset-utilization modelling, control-tower improvements, transit-time reduction and one-way vs. dedicated lane optimization
Value delivered
  • A clear, prioritized roadmap for network profitability, empty-mile reduction, asset utilization and shorter transit times
  • A network-value lens — the same thinking that underpins Valora by ANIVA AI (below)
03
Flatbed Truckload · Private Equity-Owned 2023 – 2024

Network Value Model for a Flatbed Truckload Carrier

A private-equity-owned flatbed truckload carrier wanted a holistic, quantitative view of its network economics — which markets and lanes create or destroy value once upstream and downstream effects are counted — to guide pricing, sales, planning and operations, and to give its board a simple measure of network performance. ANIVA led the project with the customer's BI, finance, operations, planning, sales and pricing teams.

Value Market-by-market network economics TSC-based bid pricing Board-level network dashboard
What we did
  • Kicked off with a core customer team, developed the scope document, and visited headquarters and a key facility to review operations, planning, pricing and data management
  • Captured and iteratively cleansed a full year of order-level operational and financial data — revenue, fixed and variable cost, fuel and accessorials, deadhead, dwell, detention, driver domicile and market definitions — into a master data set
  • Formulated and built the Network Value Model: pre-load, load and post-load margins per market area, a blended network value per market, and Total System Contribution for every origin-destination pair, capturing opportunity cost
  • Integrated network values into a mapping / BI tool with red-yellow-green ranking to spot best- and worst-performing and low-density markets
  • Built a pricing-support tab that scores bids and lanes on a TSC-based scale, recommends repricing before submission and sets minimum-rate guidelines
  • Produced a prioritized list of quick-win initiatives with owners — truck utilization, worst-operating-ratio trucks, dwell and detention, deadhead, bottom-customer repricing, driver best-practice sharing — and planned training, documentation and hand-over to the customer's network team
Value delivered
  • A repeatable, refreshable decision-support model covering every market area in the network
  • Clear guidance on which markets and lanes to push, exit, reprice or remove, embedded in the bid process
  • A monthly / quarterly leadership review cadence and a board-level view of network value
04
Consumer Products · Global Sourcing 2023

China Sourcing, Supplier Selection & Import Logistics for a Textile Start-up

An early-stage, founder-run consumer-products start-up launching bamboo-fabric apparel, bedding and pet products had no manufacturing base and no import supply chain. ANIVA acted as its outsourced sourcing and supply-chain lead for seven months — from supplier research through the first production shipments arriving at its U.S. warehouse.

Value Vetted supplier base in place Customs, tariffs & bond set up Goods landed for launch
What we did
  • Researched the bamboo-textile supply base, built and maintained a supplier pipeline dashboard, qualified candidates and presented scope, approach and proposal to the founders
  • Set up China-side support — a bilingual interpreter / coordinator and a local coordinator — and ran a weekly cadence of supplier meetings and virtual factory tours
  • Managed sampling and a face-to-face sample-selection workshop that narrowed the field to finalists; led finalist kick-offs on minimums, pricing, timing, fabric specifications, sizing, packaging, labelling and product-safety compliance
  • Benchmarked supplier quotes, consolidated all product and pricing proposals into one decision workbook, and negotiated sample-cost concessions
  • Handled import compliance — tariff classification, additional-duty determination, customs bond options, importer set-up, insurance and a foreign-trade-zone briefing — and trained the team on the tariff database
  • Gathered and normalized air, LCL and FCL quotes from multiple forwarders into a freight-cost comparison and logistics strategy; selected forwarders and routings by supplier
  • Built a locked, formula-driven shipping, receiving and inventory-tracking workbook linked to the customer's SKU list; tracked shipments daily and cleared customs holds
Value delivered
  • A vetted supplier base — finalist manufacturers in production plus a specialist supplier onboarded — where none existed
  • A complete import supply chain: classification, duties, bond, importer set-up, forwarders and routings
  • Production goods moving by air and ocean and landing at the customer's warehouse in time for launch, with working tools handed to the team
05
Automotive / EV · Order-to-Cash 2022

Order-to-Cash Invoicing Process Review & SOP

A global lead-logistics (4PL) provider and its international freight-forwarding division, supporting a fast-growing electric-vehicle manufacturer, were seeing invoice rejections, rework and slow cash collection — with no documented procedure from shipment order to payment. ANIVA led a cross-entity review to build a robust, repeatable order-to-cash process with clear ownership.

Value End-to-end O2C process & SOP Clear RACI ownership KPI framework
What we did
  • Scoped the review and interviewed stakeholders across the 4PL, the forwarder, the freight-audit firm and the customer; verified process artifacts against contractual obligations
  • Performed gap and root-cause analysis and delivered a findings readout
  • Designed an eleven-step order-to-cash process — from order receipt through execution, invoicing, audit, payment, close-out and KPI reporting — with swim-lane flows and a defined activity cadence
  • Built a RACI matrix assigning ownership of every activity across the three parties and authored a formal, controlled Standard Operating Procedure
  • Delivered a prioritized continuous-improvement register (24 opportunities), proposed KPIs and a monitor-and-maintain plan with quarterly reviews and change control
Value delivered
  • A validated, documented end-to-end order-to-cash process and SOP where none previously existed
  • Clear accountability, structural causes of rejections removed, and defined invoicing timelines
  • A KPI framework covering invoice timing and accuracy, unbilled shipments, rejections and receivables
06
Dry-Van Truckload · Publicly Traded 2021 – 2022

Pricing & Network Strategy for a Truckload Carrier

A publicly traded dry-van truckload carrier — company drivers, owner-operators and a brokerage arm — wanted long-term profitability inside a contract-network structure: denser lanes and markets, more diversified customers, market-aligned rates and less out-of-network freight. It needed an objective, network-aware way to measure market and customer profitability and feed it into pricing and bids. ANIVA built the model behind that strategy.

Value Network Value Model adopted by the network team Denser lanes, less empty More selective bidding
What we did
  • Developed a Network Value Model on 52-week rolling truckload history from the TMS: pre-load, load and post-load profitability by market area, blended network value per zone, and Total System Contribution for origin-destination pairs including upstream and downstream opportunity cost
  • Delivered map-based red-yellow-green ranking of market areas by network value for quarter-over-quarter tracking
  • Enabled tracking of market profitability and customer network contribution at enterprise, origin and lane level
  • Provided what-if scenario capability for the network, pricing and sales teams and integrated the TSC metric into the pricing template
  • Supported the tiered network strategy (hub-to-hub, hub-to-neighbor, neighbor-to-neighbor, brokerage) and a network / pricing KPI framework — rate per mile, tier progression, lane density, empty percentage, bid funnel and scorecard
Value delivered
  • Lane combinations consistently decreased and empty percentage trended down as orphan markets were reduced and hub-tier share grew
  • Poorest-yielding freight managed up or out; better customer diversity and less dependence on single customers
  • Awarded bid volumes stayed strong while bidding more selectively; the model became the team's ongoing tool for monitoring network profitability
07
Beverage / CPG · Truckload 2021 – 2022

Dedicated Truckload Network Strategy & Carrier Bid

A large regional beverage bottler and distributor had drifted into heavy spot-market exposure as volumes grew and capacity tightened; earlier bids had been out of step with the budget cycle and lacked firm business rules and a routing-guide waterfall. ANIVA joined the customer's core bid team to build an in-house bid capability and a dedicated-plus-one-way truckload network with guaranteed, contracted capacity.

Value 90%+ of freight under contract (target) Guaranteed capacity In-house bid capability
What we did
  • Defined the carrier procurement and bid strategy for a dedicated + transactional network and aligned it with leadership and stakeholders
  • Framed a "dedicated value delivery" model: strategic carrier relationships, guaranteed daily capacity at contracted rates with seasonal surge flexibility, service commitments and annual reviews
  • Designed the bid scope and packages — lane-level forecasts, dedicated bundles priced fixed-and-variable, one-way lanes at flat linehaul, fuel schedule and standard contract framework
  • Built a multi-attribute carrier evaluation (service, cost, quality, capability, capacity) with a scoring rubric, finalist reviews and best-value awards loaded into the TMS routing guide
  • Set the bid structure, a wide-net carrier invitation strategy and market timing supported by third-party freight forecasts
  • Laid out a 16-step process and deliverables roadmap and documented lessons learned from the prior bid
Value delivered
  • A network strategy targeting 90%+ of truckload freight under contract with published routing guides, sharply reducing spot exposure
  • Guaranteed capacity, more predictable service and more consistent pricing from an expanded, vetted carrier base
  • An institutionalized in-house bid capability — templates, cadence and rules the customer now owns
08
Chemicals · Ocean Export 2021

End-to-End Export Container Process Redesign Pilot

A Fortune 100 chemical manufacturer, mid-way through an enterprise process-transformation program, needed a state-of-the-art design for its international packaged-cargo (FCL export) process — something it could not achieve without a freight forwarder's expertise and systems. ANIVA worked on the forwarder's project team to co-design and pilot the new process with the shipper and its transformation consultants.

Value Shorter cycle times Lower carrying cost & detention Digital-ready process
What we did
  • Co-defined the problem statement, statement of work, deliverables and scope boundaries; identified stakeholders and aligned a joint shipper / consultant / forwarder team
  • Documented current-state order-to-ship, booking and clean-order-review flows and articulated the benefit case
  • Designed the future-state framework: a forecasting cascade (annual → 90-day → 30-day), pre-booking, forecast-to-order reconciliation and an exception dashboard
  • Mapped forwarder tools (TMS, order management, EDI / API integration, tracking, e-docs, customer portal) to the design and captured IT assumptions and data requirements
  • Defined the pilot approach — design working sessions, RACI and documentation updates, business rules, sandbox testing, success criteria and lessons learned
Value delivered
  • A co-designed, digital-ready future-state process targeting shorter cycle times, lower inventory carrying cost and container detention, fewer hand-offs and better visibility
  • A tested proof-of-concept and documented design gaps for the enterprise program to build on
09
Oil & Gas Services · Lead Logistics 2020 – 2021

Global Ocean & Air Freight Procurement

A global lead-logistics provider (4PL) implementing a managed-transportation program for a Fortune 500 oilfield-services company found much of the shipper's international ocean and air freight moving un-contracted at spot rates across every region of the world. ANIVA served as a core member of the bid team charged with bringing high-volume lanes under contract through a structured global bid.

Value Spot → contract rates in every region Reusable global lane data set Repeatable scorecard awards
What we did
  • Consolidated and cleansed shipment history from multiple providers into validated global lane files by mode (air, FCL, LCL) with annualized volumes
  • Defined the bid strategy: lane segmentation (contract the volume, leave micro-lanes on spot), provider slate, regional compliance requirements, award terms and market timing
  • Designed bid packages and cost-breakdown structures for air service levels and ocean port-to-port pricing
  • Ran a two-round global RFQ, compiled and normalized responses, and estimated total cost by provider
  • Built a scorecard-based selection methodology (price, quality, transit time, tracking / IT capability) to rank providers and assign primary, secondary and tertiary awards by lane and mode
  • Supported baseline finalization, savings estimation, contract award and lessons-learned close-out; ran a parallel domestic flatbed, truckload and LTL bid
Value delivered
  • Structured, contract-based ocean and air procurement across all regions, replacing largely spot-rate operations
  • A clean, reusable global lane data set for bidding, baselining and ongoing management
  • A repeatable, transparent scorecard award process the customer can run again
10
Trucking & Brokerage · Systems Assessment 2016

TMS & Process Assessment for a Beverage Bottler's Transportation Subsidiary

The transportation and fleet subsidiary of a large regional beverage bottler — company assets, an owner-operator network and a brokerage — was growing fast, but its heavily customized TMS was delivering only part of its potential, with tedious manual workarounds. In a 30-day assessment, ANIVA reviewed systems, processes and organization against best-in-class carriers and delivered a prioritized roadmap plus a two-phase optimization proposal.

Value 30-day independent assessment 13 prioritized recommendations Two-phase optimization roadmap
What we did
  • Ran a multi-day on-site assessment — leadership kickoff and stakeholder interviews across customer service, load planning, dispatch, fleet, brokerage, settlements, IT and reporting, with direct observation of the TMS in daily use
  • Inventoried every purchased TMS module and classified each keep / return / renegotiate, cutting annual software service fees
  • Delivered 3 major and 10 additional short-term recommendations — system fixes, a version-upgrade path, terminal scanning and imaging workflow automation, IT organization design, training and configuration corrections
  • Provided long-term recommendations: trailer tracking, fuel and driver management, claims workflow, and in-house P&L capability through an ERP-to-TMS interface
  • Answered 20+ technical questions raised by TMS user groups during the visit
  • Proposed a two-phase optimization: Phase 1 (~4 weeks) — a network value model for the owner-operator network with profitability and Total System Contribution by customer and market; Phase 2 (~8 weeks) — right-sizing company assets and extending the model into a predictive mode-choice tool across company drivers, owner-operators and brokerage
Value delivered
  • A keep / return / renegotiate software rationalization with immediate annual fee savings identified
  • A prioritized short- and long-term roadmap projected to lift TMS effectiveness and user confidence markedly
  • A scoped, costed path to network value optimization across all three fleets — assets, owner-operators and brokerage
11
Air Cargo · Terminal Operations 2016

Cargo Terminal Operations Review for an Island-Market Air Cargo Carrier

A regional inter-island air cargo carrier — an operating company of a diversified transportation group — had just moved into a new, larger cargo facility and was about to install a roller-deck system, yet its operation showed excess handling, no put-away or picking discipline and fixed crew sizes regardless of workload, with productivity per employee slipping. ANIVA reviewed day and night operations on site and delivered a prioritized improvement plan to leadership.

Value Prioritized improvement plan New productivity KPI Variable labor model
What we did
  • Observed aircraft off-loading, breakdown, build-up, loading and interline handling across day and night shifts; interviewed operations staff and reviewed schedules, workforce grouping, the roller-deck layout and the action list
  • Gave real-time feedback during the visit and an end-of-visit recap and prioritized opportunity list to leadership
  • Recommended an integrated facility layout using industrial-engineering methods (activity-relationship and freight-flow analysis) and a detailed roller-deck operating process with roles, SOPs, cross-training and hard / soft savings tracking
  • Proposed labor models — staggered crew start times, a hybrid fixed / variable workforce, seasonal adjustment, standardized loader crews and a volume-driven crew model for the mainland wide-body flight
  • Identified revenue and margin levers (cube- vs. weight-based pricing, storage and dwell fees, premium handling for late freight), equipment rationalization and multi-stop schedule optimization
  • Designed a facility-level productivity KPI (hours per unit load) with baseline and goal, and an operations cost-control process to manage projects and validate savings with finance
Value delivered
  • A prioritized set of roughly a dozen process, cost and revenue opportunities delivered to leadership
  • A new operational KPI and measurement framework to prove the benefit of the roller-deck investment
  • A labor model that flexes with volume instead of fixed crews
12
Truckload · Network Value 2015

Network Value Formulation & Profitability Dashboards for a Truckload Carrier

A Pacific Northwest truckload carrier — an operating company of a diversified transportation group — was losing profitability to empty miles, driver dwell and pricing decisions made without system-wide visibility. In a six-week engagement, ANIVA built the original Network Value Formulation: the marginal value of a truck in every market area, and a Total System Contribution score for every lane.

Value NV / TSC adopted company-wide Revenue & profit up within a year Carrier later sold at a premium
What we did
  • Developed the Network Value Formulation — a network value for every zone from pre-load, load and post-load profitability, and Total System Contribution for every origin-destination lane — so pricing and load acceptance reflect downstream network effects, not just the rate
  • Integrated some 19 months of order-level TMS history with finance data, converting cost-per-mile into zone-to-zone lane costs
  • Built year-over-year deadhead dashboards with reduction strategies, and a driver dwell dashboard flagging the worst zones for monthly corrective action
  • Delivered best / worst lane and zone analyses with grow-fix-exit strategies; evaluated the next year's growth plan and live sales bids using NV and TSC
  • Set up governance — a network value creation scorecard with ten initiatives and named owners, biweekly dashboards and quarterly model refreshes
  • Documented the models, trained internal owners and handed everything over with an implementation plan
Value delivered
  • NV / TSC adopted by pricing, operations and network planning, with trained owners and an ongoing refresh cadence
  • Revenue and profitability improved within a year of rollout
  • The improved performance helped the parent group later sell the carrier at a premium — and this engagement seeded the Network Value methodology now productized in Valora by ANIVA AI
13
Automotive / 3PL · Agreement Assessment 2015

3PL Agreement Assessment & Cost-Reduction Roadmap for an Automotive Sub-Assembler

A year into a 3PL supply chain management agreement covering a Detroit-based sub-assembler — shipping instrument-panel assemblies and raw materials for a major OEM's vehicles — the operation had launched without network design or carrier bidding and was being managed reactively, lane by lane. ANIVA assessed the agreement end to end and turned it into a governed, measurable operation with a costed savings roadmap.

Value Savings ≈ 3% of freight spend identified Freight-audit gap closed Reactive → proactive governance
What we did
  • Reviewed the agreement's history, scope and services delivered versus contracted — a full gap analysis across people, process and technology
  • Documented the operation: roughly $16M of managed freight, ~130 production suppliers and ~110 loads a day across truckload, LTL, milk run, intermodal, ocean, air, expedite and parcel in the US, Canada and Mexico
  • Separated controllable cost drivers (carrier performance, routing, rates, data integrity) from customer-side drivers (material releases, expedites, mis-shipments) to end the firefighting
  • Built the visibility layer — executive dashboard, supply chain footprint maps, yard and truck-arrival visibility, daily inbound / outbound reporting, and freight cost allocated by assembly line
  • Redesigned the freight-bill audit: full truckload audit through the TMS, a new validation workflow for LTL and parcel bills that had been paid as presented, and an EDI auto-audit design with tolerance-based matching
  • Prioritized network savings — truckload and LTL rebids, milk runs, intermodal and mode shifts — into a short / mid / long-term roadmap with a tracked scorecard
Value delivered
  • Carrier rate opportunities exceeding half a million dollars a year identified — roughly 3% of the managed freight spend
  • A freight-payment control gap closed, with every mode under audit or validation
  • Product-level logistics cost transparency — freight cost by assembly line — and zero freight claims under the managed operation
  • A reactive operation turned into a governed one: dashboard, KPIs and a phased improvement roadmap
14
Automotive Manufacturing · 3PL Outsourcing 2014 – 2015

3PL Selection for In-Plant Logistics Outsourcing at a Detroit Auto Supplier

A Detroit-based tier-1 automotive interiors supplier to a major OEM ran its production control & logistics largely by hand, with no warehouse or yard system, rising inventory days and downtime risk. ANIVA designed and ran the outsourcing decision end to end: RFP, bid package, technical reviews, bid analysis and final service-provider selection between two competing proposals.

Value End-to-end RFP process Two competing bids evaluated Clear provider recommendation
What we did
  • Spent some two months on site observing assembly lines and interviewing staff at every level, then converted the concerns and symptoms into KPIs and measures of success with resolution tracking
  • Assembled the bid package — facility layout, production rates, plant calendar and shifts, container data, plan-for-every-part database and truck schedules — issued the RFP and hosted bidder site visits
  • Ran the competitive process with two 3PL bidders under NDA, from proposals through directional price quotes
  • Analyzed both proposals against scope: capability comparison, SWOT of each bidder and of the status quo, headcount analysis and directional price comparison
  • Defined the decision process — go / no-go sign-off, technical reviews, bidder ranking, business case and final approval — and the implementation roadmap (LOI, SOW / MSA, service levels, systems setup, training, phased go-live)
  • Delivered the final recommendation: a national 3PL bringing WMS / YMS, barcode scanning, ASN receiving, ABC storage, lean methods and a control tower to the plant floor
Value delivered
  • A structured, criteria-based selection completed on schedule, with a clear preferred provider from two competing bids
  • A KPI framework tied directly to observed plant pain points, so success could be measured after go-live
  • A path from manual, in-house PC&L to systems-driven in-plant logistics — real-time inventory visibility, fewer inventory days and lower downtime risk
15
Trucking & Logistics · Multimodal 2014

Network Analysis & Cost-Reduction Roadmap for a Northern-Market Carrier

A truckload, LTL, flatbed and multimodal carrier — an operating company of a diversified transportation group — links a lower-48 gateway terminal by ocean sailing to a network of terminals in a remote northern market. It had rich revenue data by lane but little visibility into lane-level operating cost, relied on tribal knowledge with no route- or load-planning tools, and was spending heavily on leased trailers and fragmented purchased transportation. ANIVA analyzed the network end to end and delivered a prioritized cost-reduction roadmap.

Value Four prioritized savings initiatives Consolidated carrier procurement Cost-control governance
What we did
  • Visited the two main gateway / hub terminals; interviewed process owners on loading, distribution, dispatch and planning-tool needs
  • Analyzed eight months of network data — terminal footprint, origin / destination zones, pickup-and-delivery, line-haul and purchased-transportation moves by mode with mileage, weight and cost; trailer usage between hubs; northbound manifests for consolidation opportunities
  • Benchmarked purchased-transportation cost per mile and per pound against target ranges and designed a consolidated carrier RFQ with a decision matrix and on-boarding process
  • Analyzed the leased trailer pool and its root causes and proposed a centralized trailer-control process
  • Recommended better load preparation at the gateway and pickup-and-delivery / line-haul optimization using route-optimization software (cluster, meet-and-turn, zone and milk-run designs) with illustrative routes for several terminals
  • Identified further opportunities — cross-dock rate benchmarking, daily hub tag-ups, dispatcher tools, workforce model, terminal rationalization, scanning, volume leveling — and delivered a Transportation Cost Control tracking process with a weekly cadence
Value delivered
  • Four prioritized initiatives — consolidated procurement, trailer equipment management, load preparation and route optimization — with a substantial combined annualized savings opportunity, plus eight further opportunities identified
  • A governance process and template to track savings against target every week
  • A path from reactive "you call, we haul" operations to planned, tool-supported routing

Common threads

  • We join the customer's team and work on-site, from data capture through implementation
  • Every engagement leaves behind a repeatable process — templates, scorecards, models, SOPs, KPIs and fully deployable decision support tools the customer gets to utilize in their operations
  • Value is measured against a baseline the customer agrees to before the work begins

To discuss a similar engagement, email mani@anivaenterprises.com.

Strategic Logistics & Supply Chain Design

Design the least-cost network for the next three to five years — modeled, simulated and agreed with your team before a single move is made.

3–5 years horizon Network-level design Modeled & simulated
How It Works
1

Perform Current State Analysis

  • Gather, analyze and validate data
  • Existing warehouse locations and operations
  • Warehouse / DC operating policies and constraints
  • Shipment flow data and available pertinent costs
  • Opportunities for consolidation or deconsolidation
2

Perform Network Redesign

  • Optimize the number and locations of warehouses
  • Based on current supply base and demand points
  • Based on product flows and optimum opportunities
  • Optimum allocation of products to warehouses
  • Review and refine the design with stakeholder feedback
3

Plan Implementation Cadence

  • Phased rollout with milestones and owners
  • Tracking cadence agreed with your team
  • Risk and contingency planning for critical transitions
  • Documentation, training and model handover
  • Value measured against the agreed baseline
What We Will Ask You For

Data requirements are defined up front — six categories, and nothing more than the design needs.

Facility Data

  • Warehouse / DC locations (address, DUNS, lat / long)
  • Supply locations and demand / customer locations
  • Operating parameters and constraints

Supply Chain Cost Data

  • Warehouse / DC operating costs (fixed and variable)
  • Transportation costs ($ / mile or $ / cwt by region)
  • Product value, carrying and pipeline costs; packaging

Product Data

  • Type and number of products
  • Volumes shipped from each supplier
  • Volumes required at final customer locations

Capacity & Restrictions

  • Warehouse / DC sizes (square feet)
  • Weight, volume, SKU and storage limitations

Material Flow Data

  • Supplier to warehouse / DC flows (who ships where, how much)
  • Warehouse / DC to customer flows by weight, volume and mode

Other Design Data

  • Preferred warehouse / DC candidate sites
  • Any pertinent site or policy data
What We Analyze
  • Origin-based vs. destination-based network design
  • Integrated inbound transportation, warehousing, production planning & inventory control
  • Supplier / customer assignment to cross docks, warehouses and DCs to reduce transportation costs
  • Multi-plant / multi-warehouse drop-off network design
  • Truck vs. rail optimization between suppliers, warehouses and customers
  • Optimize the number and location of warehouses, DCs and cross docks

Strategic network design — baseline vs. optimized

Illustrative — optimize the number, location and role of warehouses / DCs against total landed cost and service
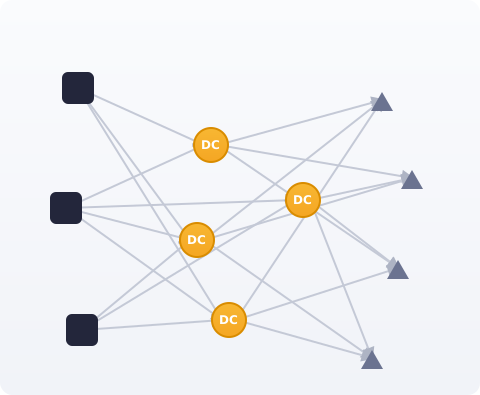
Current network
Baseline network: three plants shipping through four overlapping DCs with crossing lanes to four customer zones

4 DCs · overlapping territories · crossing lanes
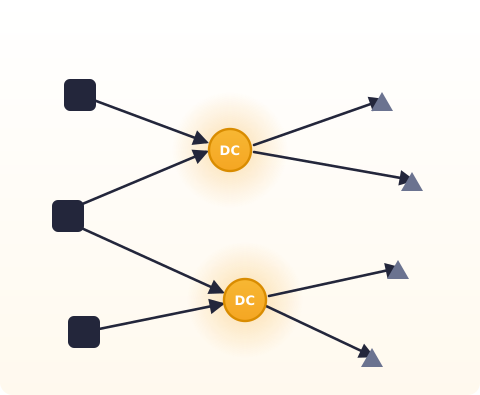
Optimized network
Optimized network: the same plants and customers served by two right-sized DCs with clean, single-assignment lanes

Right-sized DC footprint · clean territories · lower total landed cost

Suppliers / plants Warehouses / DCs Customers / demand
You get Least-cost network design Savings estimate vs. baseline Implementation roadmap See engagements like this →

Tactical Logistics & Supply Chain Design

Quick-win cost reduction on the network you run today — route, cube, frequency and mode, delivered in weeks.

1–3 months horizon Quick-win savings Route, cube & mode
How It Works
A

Assess steps 1–4

  • Map the current-state logistics processes and understand the gap
  • Develop the scope and gather data
  • Study existing 3PL / core carriers and estimate current inbound route costs
  • Take control of inbound shipment data and review every shipment for consolidation opportunities
B

Optimize steps 5–7

  • Analyze inbound practices and identify optimization opportunities — route, cube and mode
  • Pick constraints and time buckets judiciously: production, demand / supply, equipment capacity, facility storage, carrier / DOT rules, backhaul opportunities
  • Run route optimization using commercial logistics planning software
  • Map the proposed-state logistics processes
C

Implement & Sustain steps 8–10

  • Implement the proposed network design and logistics processes
  • Continuous improvement to keep inbound costs within budget: cube improvement, route redesigns, frequency and mode changes, multi-plant drop-off, operating-rule revisions, constraint elimination
  • Routing-guide compliance and carrier scorecards to sustain savings
  • Measure and report operational, financial and compliance KPIs
Focus on Immediate Cost Reduction

Four logistics cost levers — open each to see the cost elements we attack.

1

Freight

  • Transportation costs
  • Cross dock charges
  • Cross border charges
  • Invoicing expenses
  • Freight pay & audit costs
  • Receiving costs
  • Loading / unloading costs
  • EDI costs / IT expenses
  • Management charges
2

Warehousing

  • Startup costs
  • Facility costs
  • Labor costs
  • Equipment costs
  • Maintenance costs
  • Utilities / trash removal
  • Materials / supplies
  • IT expenses (WMS)
  • Supervisory expenses
3

Inventory

  • Ordering costs
  • Carrying costs
  • Pipeline costs
  • Scrap expenses
  • Insurance charges
  • Cost of capital / money
  • Taxes / liabilities
  • IT expenses (ERP)
  • Management costs
4

Packaging

  • Design costs
  • Equipment costs
  • Handling charges
  • Storage costs
  • Repair expenses
  • Loading / unloading costs
  • Distribution costs
  • IT expenses (CMS)
  • Management costs

Data collection involves part packaging information, supplier and plant location data, delivery needs, dock constraints, transportation modes, truck capacity and other critical information.

What We Analyze
  • Route, cube, frequency & mode optimization
  • Changes to service provider agreements and existing carrier contracts to reduce cost
  • Optimized material flows to and within warehouses, DCs, sequencing, subassembly and cross docks
  • Operating plan creation and validation of inbound logistics designs
  • Redesign by challenging existing policies, work rules and other operational / design processes

Tactical inbound optimization — route, cube & mode

Illustrative — consolidate direct shipments into milk runs, fill the cube, and pick the right mode
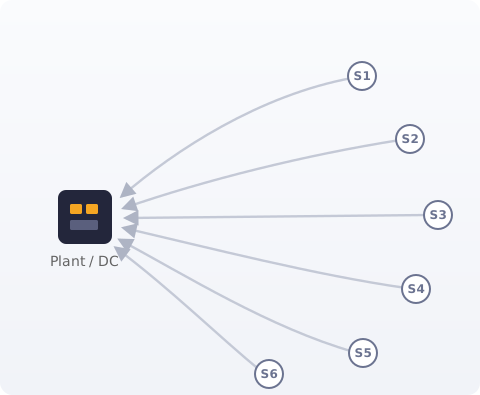
Before — direct, one-off shipments
Before: six suppliers each sending a part-full truck directly to the plant

6 suppliers · 6 part-full trucks · empty miles
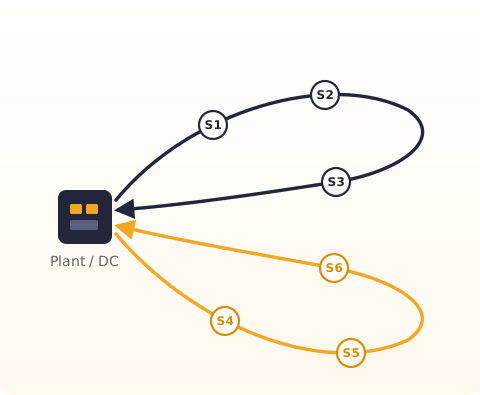
After — consolidated milk runs
After: the same six suppliers served by two consolidated milk-run loops with fuller trucks

2 milk runs · full cube · right mode · fewer trucks

Trucks required ▼ Cube utilization ▲ Cost per unit ▼

Route · cube · frequency · mode — optimized with commercial planning software, within production and dock constraints

You get Quick-win savings list Route, cube & mode plan KPI & cost-control tracker See engagements like this →

The network, in motion

A month of truckload movement across the United States

A sample month of real truckload movement across U.S. markets. Every dot is a tractor traveling between two markets — blue when loaded, orange when running empty.

Network in motion — sample view day 1 of 28
Week
Speed —

Zones — ● pickup surplus ● balanced ● delivery surplus · sized by monthly activity · hover a zone for its numbers

Straight lines between markets, not road routes — bending only to round the Great Lakes — the data holds an origin, a destination and a duration. Switch to Empty only to see what the network costs when nothing is paying for the move — the movement data Valora turns into network value.

Introducing

Valora by ANIVA AI

A network value creation application for truckload operations — pricing, network balance, load selection and customer profitability in one place.

Load value TSC Total System Contribution
=
Profit on the load revenue − cost
+
Network value at destination where the truck ends up
−
Network value at origin where the truck started

Measured per truck-day and per load, for every market — not rate per mile.

The idea

Rate per mile hides where a fleet actually makes money. Valora measures every load by its Total System Contribution — the profit on the load plus the change in network value between where it ends and where it starts — per truck-day and per load, for every market.

What it delivers

  • Network value per truck-day for every market and lane
  • A weekly-refreshed reprice list and customer ranking by net opportunity
  • Market imbalance analysis with surplus / shortfall pairing for sales and dispatch
  • Round-trip lane-pair scoring and shipper dwell benchmarking
  • A live dispatch menu that rescores as a rate is typed

How we start

  1. 1
    Assessment (4 – 6 weeks) — your data, your number
  2. 2
    Build & go-live (4 – 8 weeks)
  3. 3
    Full roll-out (first year), value tracked against the assessment

Runs on your own leg-level history — no system integration required. Built for regional and national fleets of roughly 500 to 2,000+ tractors.

Let us show you your own number — start with an assessment.

Also from ANIVA AI

Optara by ANIVA AI

Truckload carrier bidding, selection and execution — end to end. Send the bid, rank rates and capacity, negotiate rounds you can measure, award within commitments, and hand your TMS the routing guide.

1 Plan→ 2 Build files→ 3 Invite→ 4 Round 1→ 5 Targets→ 6 Round 2→ 7 Award→ 8 Execute

One tool, eight steps — every step a screen, every event one auditable database.

The idea

The annual truckload bid outgrew its tools: hundreds of lanes, dozens of carriers, thousands of quotes — run through email threads and one master spreadsheet, and awarded on rate alone. Optara awards rates and capacity: the waterfall builds the routing guide itself — Primary, Secondary, Tertiary, every carrier at their own quoted rate, never past their own commitment.

What it delivers

  • A carrier-safe, seven-sheet bid package sent in one click
  • Every response screened and validated before it touches the rankings
  • Negotiation rounds with lane-by-lane targets — movement measured, not guessed
  • An award with a full audit trail and savings you can defend
  • A TMS-ready routing guide, EDI onboarding order and a carrier compliance gate

How we start

  1. 1
    See it working — a live walkthrough of a complete bid on fully illustrative data
  2. 2
    Run your first bid with us — your lanes and carriers, our team beside yours through every round
  3. 3
    Then you run it — your license, in your building, for every event after

Runs entirely on your own hardware — no cloud, no per-seat SaaS. Your rates never leave the building.

920Lanes priced
60+Carriers on the bid
10,000+Quotes ranked
8–10%Savings identified

A representative bid event — illustrative figures.

Your first bid, run together — book a walkthrough.